
Contact Info
2nd Floor, House-42, Road-20, Sector-11, Uttara, Dhaka-1230
+8801711-286015
info@tishost.com

cPanel Hosting
337
Jun 15,2019
How can I check my website access logs?
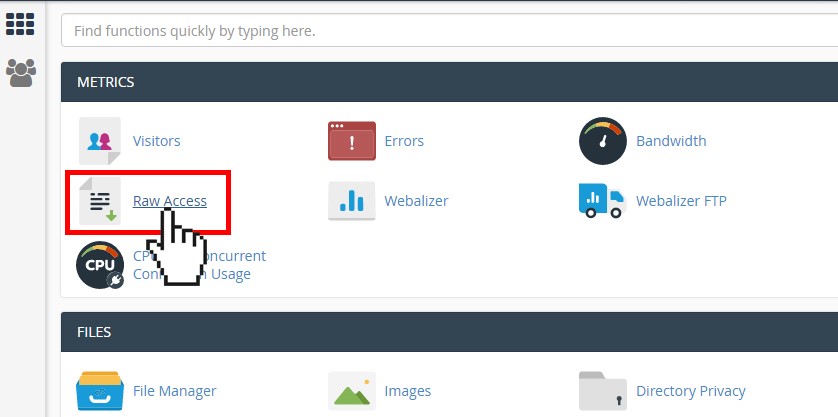
First, you need to login to your cPanel account. Locate and click RAW access under the metrics section.
Using the Raw Access Logs menu in cPanel, you can check the traffic coming to your website before it is turned into a report by the statistics software. It is a great functionality to take a closer look at the type of the requests your websites are getting.
You can access it in the following way:
For cPanel Basic Theme
For cPanel Retro Theme
For cPanel Basic Theme:
Log into your cPanel > Metrics section > Raw Access menu:
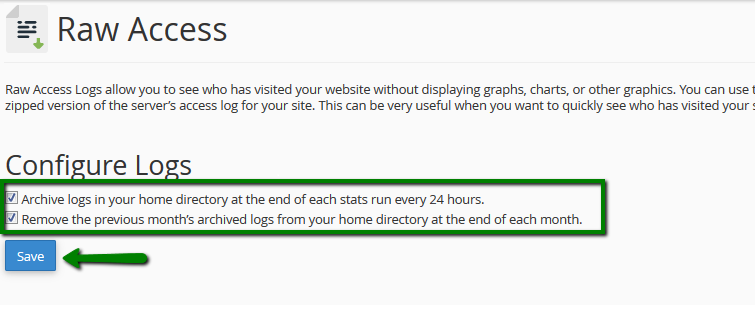
In the Configure Logs section, you can set up cPanel to automatically archive and remove the logs.
Make the necessary changes and click on Save to apply them:
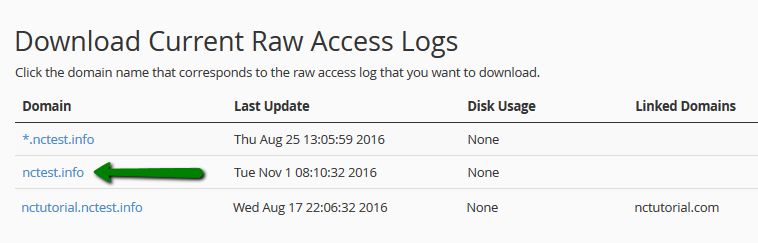
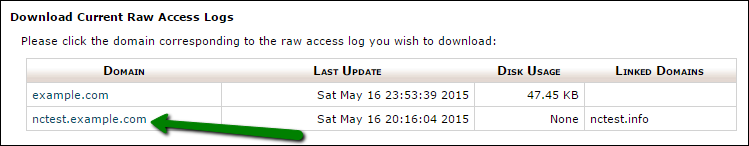
The Download Current Raw Access Logs option allows downloading the corresponding log for certain domain(-s):
- Domain: list of the domains in your account
- Last Update: the latest date when the log was updated
- Disk Usage: the amount of the disk space the log file takes
- Linked Domains: list of the addon/parked domains
To download the archived log file, simply click on the domain in question:
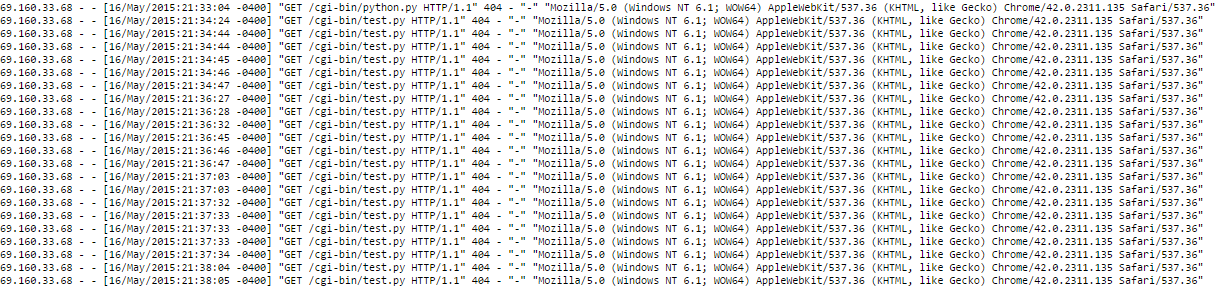
Once downloaded, extract the file locally and view it using any text editor. You will see the following output:
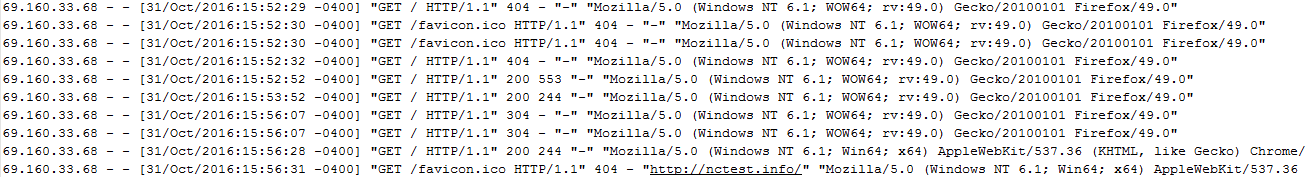
Each line begins with the identity of the agent that visited your website (generally, an IP address is recorded).
Next, the date and time are logged.
Then you may see the type of HTTP request sent by the agent (usually GET or POST).
The next field is a relative path to a file/image/query and HTTP version (1.1 in the example).
A three-digit code displayed specifies the resulting status of the request: 404 – not found, 200 – success.
The next portion of logs identifies the referrer, if any - a hyphen in our example.
Although, null-referrer values are common for robots, the actual URI data is generally typical for human users.
Finally, the formal identity and credentials of the user-agent are specified.
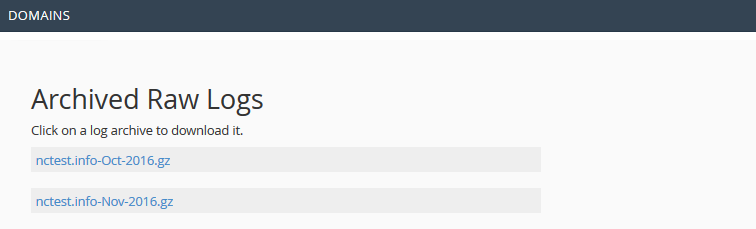
If you wish to download archived logs which are stored in the account home directory, click on the corresponding one in the Archived Raw Logs section:
If you would like to see the advanced graphical reports for the hosted domains, use the Awstats menu.
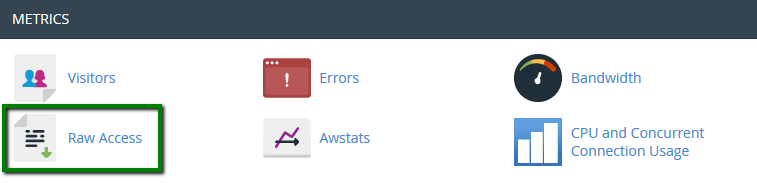
For cPanel Retro Theme:
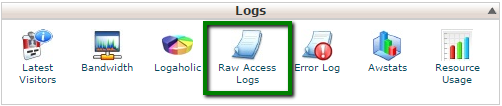
Log into cPanel > Logs section > Raw Access Logs menu:
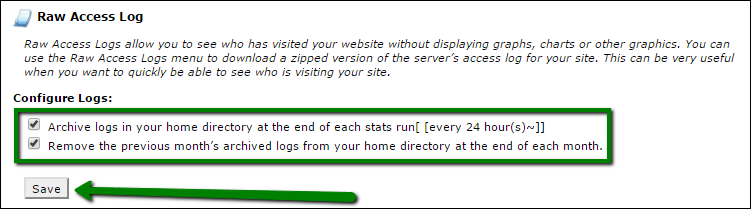
In the Configure Logs section, you can set up cPanel to automatically archive and remove the logs.
Make the necessary changes and click on Save to apply them:
The Download Current Raw Access Logs option allows downloading the corresponding log for certain domain(-s):
- Domain: list of the domains in your account.
- Last Update: the latest date when the log was updated.
- Disk Usage: the amount of the disk space the log file takes.
- Linked Domains: list of the addon/parked domains.
To download the zipped log file, simply click on the domain in question:
Once downloaded, extract the file locally and view it using any text editor. You will see the following output:
Each line begins with the identity of the agent that visited your website (generally, an IP address is recorded).
Next, the date and time are logged.
Then you may see the type of HTTP request sent by the agent (usually GET or POST).
The next field is a relative path to a file/image/query and HTTP version (1.1 in the example).
A three-digit code displayed specifies the resulting status of the request: 404 – not found, 200 – success.
The next portion of logs identifies the referrer, if any - a hyphen in our example.
Although, null-referrer values are common for robots, the actual URI data is generally typical for human users.
Finally, the formal identity and credentials of the user-agent are specified.
If you wish to download archived logs which are stored in the account home directory, click on the corresponding one in the Archived Raw Logs section:

If you would like to see the advanced graphical reports for the hosted domains, use the Awstats menu.
That's it!
"Our guide will help you understand the underlying principles of WordPress optimization"
Rasalina Willamson
Ut enim ad minima veniam, quis nostrum exercitationem ullam corporis suscipit laboriosam, nisi ut aliquid ex ea commodi consequatur Quis autem vel eum iure reprehenderit qui in ea voluptate velit esse quam nihil molestiae
Share this Post

How to create a symbolic link in cPanel
By TisHost
How to manage domains in cPanel
By TisHostRecent News
-

-

How to Create Addon Domain1
By TisHost -

How to add custom error pages1
By TisHost -

How to use File Manager in cPanel1
By TisHost -


Trusted By
900+
Client World wide
24x7x365
Professional Technical Support
Providing Cloud
Services
Since 2008
Network Uptime
99.9%
Server Uptime